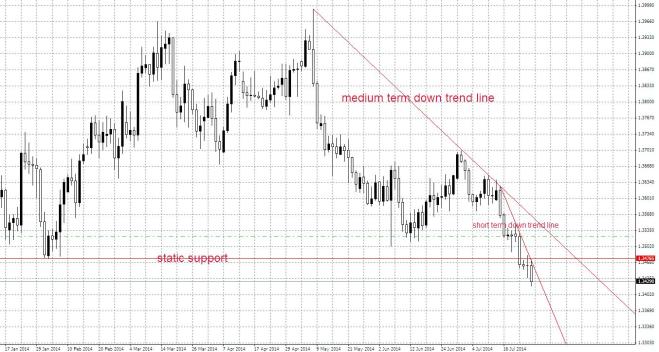
Daily EUR/USD candlestick chart. The movement is still under the medium term down trend line, but the (very steep) short term down trend line was broken yesterday. Today it seems that there is a inside bar. Tuesday I’ve closed the short position that I opened last week (in gain).
Question: Why have I closed the short position on Tuesday?
Answer: There where several reasons: I was in gain; the short term down trend line was very steep; the short term was broken, so I expected a reaction; there wasn’t any pull back on the (ex) static support (now static resistance), even more so I expect a reaction. All good reasons. But I haven’t used a method …
Conclusion: The trend is my friend, until it ends. OK. Now the trend is down. So I should open a short position. Have I to open a short position now? Have I to wait for a significant pull back? Have I to use the inside bar as an entry set up? I’m not able to answer all these questions without a method … without a trading system …


