20 October 2014 – EUR/CAD – A new long position

The happy trader - EURCAD 20102014 new long position

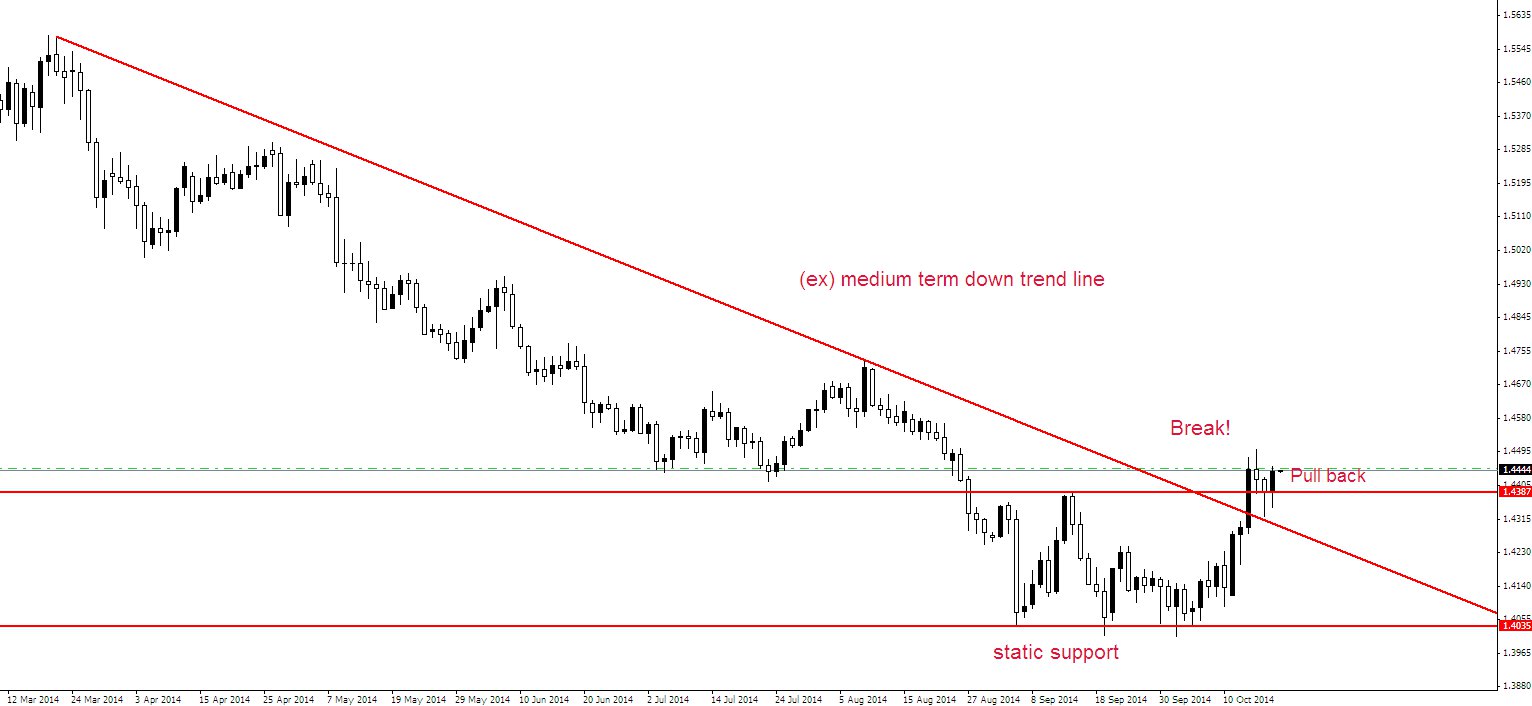
Daily EUR/CAD candlestick chart. On 17 October the daily candle had a lower shadow which touched the (ex) medium term down trend line. A perfect pull back (to the static support too: a perfect confluence). Today the daily candle has closed higher than the previous candle. The low has been higher too. So the pull back is completed, for my point of view: I’ve decided to open a new long position in the EUR/CAD.

17 October 2014 – EUR/JPY – Testing the static support

The happy trader - EURJPY 171014 testing the static support

Daily EUR/JPY candlestick chart. On 14 October the EUR/JPY pierced the static support at (about) 135,7 with a (nearly) long bearish candle with the daily close at 135,482. On 14 October the daily candle was an inside bar (aka Engulfing pattern), on 15 October the daily candle was an amazing Hammer with a very long wick (aka Pin Bar). An incredible Inside Bar False Break. The last daily candle was a Spinning Top, with the daily close above the static support. A very complex test of the static support …

17 October 2014 – EUR/GBP – A wide flat market

The happy trader - EURGBP 17102014 a wide flat market

Daily EUR/GBP candlestick chart. Last week the EUR/GBP tested the static resistance at (about) 0,7873, without breaking it. This week the currency pair has broken the static resistance (now support) at 0,7873 and has reached the static resistance at (about) 0,8033. The last static resistance has limited the price movement. It doesn’t make any sense to draw the (ex) medium term down trend line: I’ve erased it. Now the market is flat. I’m waiting for a Price Action on the supports.

13 October 2014 – EUR/JPY – I’ve just opened a long position

The happy trader - EURJPY 111014 I've just opened a long position

Daily EUR/JPY candlestick chart. On 10 October the EUR/JPY closed the daily candle on the static support. Today, after a false penetration, the daily candle has closed above the static support. It wasn’t a long bullish candle, but I’ve opened a long position anyway.

3 October 2014 – EUR/JPY – In the downtrend channel again

The happy trader - EURJPG 03102014 in the downtrend channel again

Daily EUR/JPY candlestick chart. On 18 September I claimed the EUR/JPY trend inversion. The currency pair is now again in the old downtrend channel, after having pierced the (ex) static support, now static resistance. I’m patiently waiting for the test of the old static support.

26 September 2014 – EUR/GBP – Again in a down trend …

The happy trader - EURGBP 26092014 again in a down trend

On 19 September I was wondering if the EUR/GBP would be in a flat market. That day the currency pair formed a pin bar (aka hammer), with the daily close above the static support, so the pin bar may have been the beginning of a strong reaction. But there wasn’t any strong reaction. The EUR/GBP has continued to glide over the (ex) medium term down trend line, which has acted as a weird (falling) dynamic support. The static support was pierced on 22 September, now it is a new static resistance. On 25 September the currency pair has reached a new minimum (0,77844). The last daily candle is an inside bar.